The battery life inputs determine how the battery degrades over time, and the timing of battery replacements.
Note. The battery degradation is separate from the system degradation specified on the Degradation page.
Battery Bank Replacement
When you enable battery replacements, SAM determines when batteries need to be replaced based either on battery degradation as determined by the Battery Lifetime inputs or a fixed replacement schedule that you specify. It also calculates an annual replacement cost in the project cash flow based battery replacement cost on the Operating Costs page.
No replacements
Use this option if you do not want to account for battery replacement costs, or if you want to account for them using one of the general cost categories on the Operating Costs page.
If you choose the No replacements option, SAM operates the system with no battery after the available storage capacity is depleted.
Replace at specified capacity
Use this option if you want SAM to calculate the year(s) in which batteries are replaced based on degradation of the battery's capacity caused by battery cycling as determined from the Battery Lifetime parameters.
Set Battery bank replacement threshold as percentage of the nominal battery capacity that triggers a replacement. When the battery's available capacity has degraded to this percentage, SAM replaces the battery and applies the battery replacement cost from the Operating Costs page to the project cash flow. If you set the threshold to less than 2%, SAM sets the value internally to 2% to avoid simulation issues as the battery's available capacity approaches 0% of its original capacity.
Replace at specified schedule
Use this option to specify the years when batteries are replaced and the percent of nominal battery capacity that is replaced in those years, regardless of the battery's degradation.
Click Edit array to specify the percentage of total battery capacity to be replaced in each replacement year. In the Edit Array window, click Number of values, and enter the analysis period from the Financial Parameters input page. Then in the table, type a percentage for each year in which the batteries will be replaced. The rows for the remaining years should be zero.
Battery Life Options
The battery life model determines battery's degradation, or reduction in available battery capacity over time. There are two degradation mechanisms:
•Calendar degradation is a reduction in battery capacity due to age, regardless of how the battery is used.
•Cycle degradation is a reduction in battery capacity due to the number of charge/discharge cycles.
SAM provides three options for modeling battery life:
Cycle and calendar degradation
This option characterizes the battery life parameters using tables of cycle degradation and calendar degradation rates that you can customize. SAM applies the minimum of the the two types of degradation.
Li-ion NMC/Graphite
This option for the Lithium-ion Nickel Manganese Cobalt (NMC) Oxide battery type uses an internal battery life model that you cannot modify. The model includes both calendar and cycle degradation, and applies the sum of the two types of degradation.
Li-ion LMO/LTO
This option for the Lithium-ion LMO/Lithium Titanate battery type uses an internal battery life model that you cannot modify. The model includes both calendar and cycle degradation, and applies the sum of the two types of degradation.
SAM's Li-ion battery life models are adapted from the work presented in the following papers:
•Smith, K.; Saxon, A.; Keyser, M.; Lundstrom, B.; Cao, Z.; Roc, A. (2017). Life Prediction Model for Grid-connected Li-ion Battery Energy Storage System. Presented at 2017 American Control Conference. (PDF 1.4 KB)
•Spotnitz, R. (2002). Simulation of Capacity Fade in Lithium-ion Batteries. Journal of Power Sources. Vol 113 pp 72-80 2003.
The Cycle and Calendar Degradation model is described in Section 2.3 of:
•DiOrio, N.; Dobos, A.; Janzou, S.; Nelson, A.; Lunstrom, B. (2015). Technoeconomic Modeling of Battery Energy Storage in SAM. 32 pp. NREL/TP-6A20-64641 (PDF 2.6 MB)
Cycle and Calendar Degradation
The Cycle and Calendar Degradation option determines the battery's available or effective capacity in each time step based on both calendar degradation and cycle degradation, and sets the battery capacity to the minimum of the two. For example, if in a given time step cycle degradation is 75% of total capacity and calendar degradation is 87%, SAM sets the battery capacity to 75% of the total capacity. You can verify this behavior with the Battery relative capacity to nameplate, Battery relative capacity to nameplate (calendar), and Battery relative capacity to nameplate (cycling) variables in the simulation results.
Cycle Degradation
Cycle degradation is a reduction in the battery's capacity at 100% state of charge as the battery experiences many charge/discharge cycles. The cycle degradation model relies on information about capacity fade at the number of cycles elapsed at an average depth of discharge in the Cycle Degradation table.
SAM assigns default values to the table appropriate for the given battery chemistry when you choose a battery type. You can use the default values unless you have better data from a manufacturer data sheet or other source.
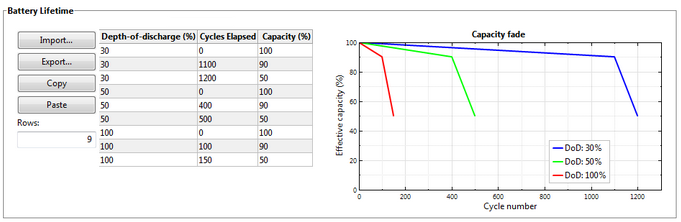
If you decide to use your own cycle degradation data, you must provide at least three rows of data in the table. For a table with more than one depth-of-discharge value, SAM uses bilinear interpolation to consider both the average depth-of-discharge and cycle number to determine the available capacity. If the table contains data for a single depth-of-discharge value, SAM only considers the cycle number in the capacity fade calculation using a rainflow counting algorithm.
For example, given the following graph from a battery's data sheet showing a curve for three different depth-of-discharge levels:
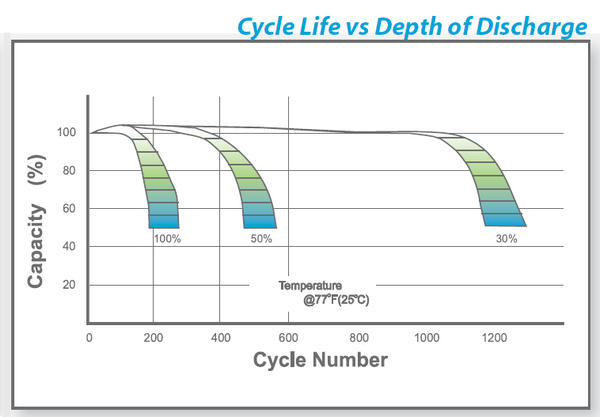
You might enter the following data in the table:
Calendar Degradation
Calendar degradation is a reduction in capacity over a battery's life that occurs over time, regardless of the number of charge/discharge cycles. This degradation may be a function of time, temperature and state of charge, or simply a function of time.
None
Choose None to ignore calendar degradation. SAM calculates capacity degradation using only the data in the Cycle Degradation table.
Empirical
Choose Empirical to use the equations shown to calculate calendar degradation for Lithium-ion batteries. The Empirical Calendar Degradation graph shows the degradation curves resulting from the equations.
The empirical model accounts for how a Lithium-ion battery's capacity degrades with time, temperature, and state-of-charge.
Custom
Choose Custom to use the Custom Calendar Degradation table to specify degradation curves. The Custom Calendar Degradation graph shows degradation curves from the data in the table.
To enter custom data in the table, click Custom, and for Rows, type the number of data points in your degradation curve. Each capacity value should be a percentage of the battery nominal full capacity. The battery age should be in days. For example, the table below shows that the battery degrades to 80% of its nominal capacity after 10 years (365 days × 10 years = 3650 days), and to 50% of nominal capacity in after 20 years.