The Data Tables tab on the Results page allows you to create a table of time series data from the performance and financial models.
To view time series data in graphical form, use the Time Series tab.
For descriptions of some key output metrics, see Financial Metrics and Performance Metrics.
To create a table of data:
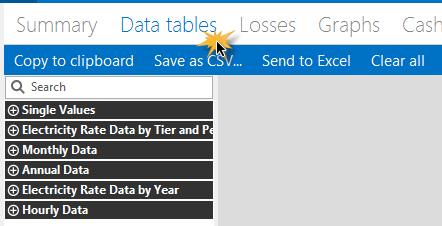
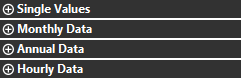
1.On the Results page, click the Data tables tab. You should see a list of variable categories: Single Values, Monthly Data, etc. If you do not see the list, run a simulation to generate results.
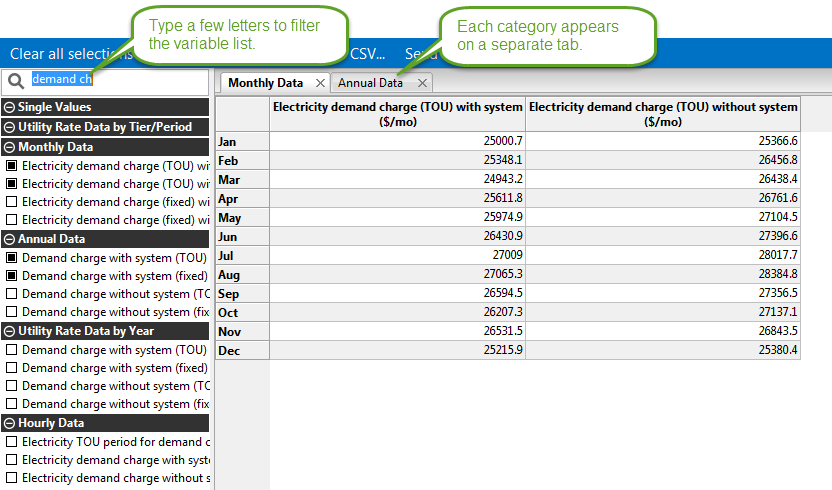
2.Expand the list to display variables in each category, and choose variables to display in the table. The categories depend on the number of values for each variable.
Type a few letters of the variable name to filter the list of variables.
Data Categories
The data categories are based on the number of values that a variable represents.
Single Values
Results that have a single value, including:
•Some input variable values from the Installation Costs, Operating Costs, Financial Parameters, and Incentive pages.
•Annual totals or averages of hourly performance model results, or time-dependent pricing data.
Monthly Data
Results that have of twelve values, including monthly averages and totals of hourly values
Annual Data
Results that have a value for each year in the analysis period, including:
•Cash flow data
•Annual output data
Note. Row 1 in the annual data table is equivalent to Year zero in the project cash flow.
Hourly Data
Results with 8,760 hourly values from the performance model results.
Note. If you do not see the Hourly Data list, run a simulation to generate the list. SAM deletes stored hourly data when you close the file to save storage space.
For subhourly simulations, SAM displays an additional category for the smallest time step, e.g., 1 Minute Data, 15 Minute Data, etc.
Utility Rate Data by Tier/Period
Results from the Residential and Commercial financial models showing monthly dollar and kWh totals by utility rate structure time-of-use period and tier.
Utility Rate Data by Year
Results from the Residential and Commercial financial models showing monthlydollar and kWh totals totals by year.
Exporting Data from Tables
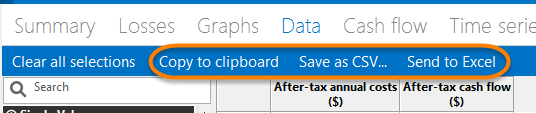
SAM offers three options for exporting data:
•Copy to clipboard copies the table to your clipboard. You can paste the entire table into a word processing document, spreadsheet, presentation or other software.
•Save as CSV saves the table in a comma-delimited text file that you can open in a spreadsheet program or text editor.
•Send to Excel saves the table in an Excel file (Windows only).