The Edit Lifetime Data window allows you to use a table to assign time series data to inputs that span either one year or multiple years over the analysis period, where the analysis period is the number of years in the simulation as defined on the Financial Parameters page. The table may have a single column for one variable or multiple columns for two or more variables.
The number of rows in the table depends on the number of simulation years and the mode. For example, for one simulation year in the Daily mode:
365 days/year × 1 year = 365 rows
For 25 simulation years in the Hourly mode:
8,760 hours/year × 25 years = 219,000 rows
Or, for 25 simulation years in the Subhourly mode with 15-minute timesteps:
4 time steps/hour × 8,760 hours/year × 25 years = 876,000 rows
Note. SAM omits leap years from the simulation, so it assumes there are 24 hours/day × 365 days/year = 8,760 hours/year, regardless of the year. It also does not account for daylight savings, so all times are in local standard time throughout the year. See Time and Sun Position for more details.
To edit the table, you can either type values by hand into the table, or import them from another program:
•Paste data from a spreadsheet program or from a text file. Use tab-delimited columns for more than one column of data.
•Import data from a text file (with tab-delimited columns for more than one column of data).
Before you try importing data from a text file, you may want to try exporting test data to a file so you can see the data format.
Note. If you copy and paste data from a spreadsheet program like Excel, change the cell format to one that does not use a thousands separator. For example, in Excel avoid the "Number" format and instead use the "General" format.
Simulation years
The number of years over which the array applies. SAM automatically sets the number of years to either one or the analysis period defined on the Financial Parameters page as required by the variable.
To change the analysis period, change its value on the Financial Parameters page. When you change the analysis period and the window is in the Hourly or Subhourly mode, SAM either adds rows of zeros to the table, or truncates the table to remove extra rows. Be sure to update the data in the table as appropriate.
Mode
Depending on the variable, the window may allow you to choose a mode to define the time scale. For other variables, the mode is fixed, and the option does not appear in the window.
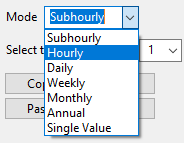
The following table describes the modes for variables that allow you to choose the length of the table.
Mode |
Description |
Number of Rows |
Subhourly |
One value applies to each time step over the analysis period. |
35,040 × N |
Hourly |
One value applies to each hour over the analysis period. |
8,760 × N |
Daily |
One value applies to all time steps in each day over the analysis period. |
365 × N |
Weekly |
One value applies to all time steps in each week over the analysis period. |
52 × N |
Monthly |
One value applies to all time steps in each each month over the analysis period. |
12 × N |
Annual |
One value applies to all time steps in each year of the analysis period. |
N |
Single Value |
One value applies to all time steps over the analysis period. |
1 |
For the Subhourly mode, you must choose the data time step.
Time step in minutes
The time step of the data in minutes.
Use the buttons to import and export data from the table.
Copy
Copy the contents of the input table to your computer's clipboard.
Paste
Paste data from you computer's clipboard to the input table.
Export
Click Export to export data from the table to a text file. Be sure to include a file extension (.txt, .csv, etc.) when you save the file.
Import
Click Import to import time series data from a properly formatted text file. The file should have one column of data, with a header in Row 1. SAM ignores the data in Row 1. To see an example of the file format, click Export and open the resulting file in a text editor.