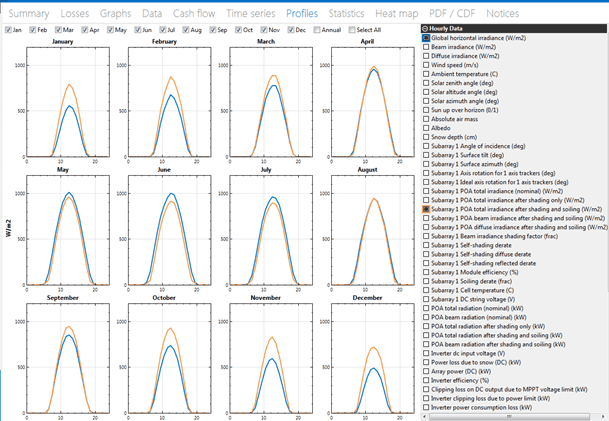
The Profile tab displays time series data as an average daily profile for each month of the year.
•Choose the variables to display in the graphs using the check boxes to the right of the graphs.
•Use the check boxes along the top to choose which months you want to appear. You can also view an annual profile, which is calculated by averaging all of the monthly profiles.
•You can only export an image or data for a single graph at a time. To export an image of all of the graphs, you can use your computer's screen capture tool (Snipping Tool in Windows, Command-Shift-4 in OS X). Resizing the SAM window will resize the graphs.