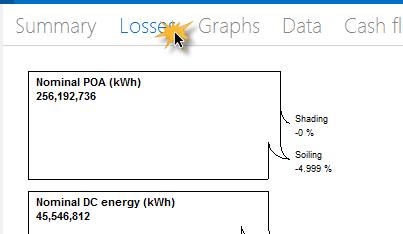
The Losses tab on the Results page displays a Sankey diagram showing the energy at different points in the system, and the source of energy losses at each point.
To view the loss diagram:
•On the Results page, click the Losses tab.
Note. SAM does not display an energy loss diagram for all of the performance models. If you do not see the Losses tab on the Results page, the diagram is not available.
Using the Loss Diagram in your Documents
SAM includes a copy of the energy loss diagram in reports.
You can also copy the diagram to your clipboard to use in documents using your operating system's clipping tool:
•In Windows 7, use the Snipping Tool (type "Snip" in the Windows search box). In Windows 7 and older versions of Windows, you can use the Print Screen key to copy an image of your screen to the clipboard.
•In OS X, press the Command-Shift-4 keys to drag an area on your screen and save it to an image file.