The electricity bill is the residential or commercial building owner's monthly electricity payment to the electric service provider. In order to calculate the value of the energy generated by the power system, SAM calculates the electricity bill with the system and the bill without the system. The savings is the difference between the two. SAM calculates the with and without system bill for the same electricity rate schedule as it is defined on the Electricity Rates page:
With system: The customer's electricity bill for an electric load met by power from both the renewable energy system and grid.
Without system: The customer's electricity bill if the entire load is met with grid power only.
Note. If you are modeling a rate switching scenario, where the electricity rate structure for the electricity bill without the system is different from the rate structure for the bill with the system, you can use the Value of RE System macro to specify two different electricity rates and calculate key metrics based on the results of two separate simulations.
Summary
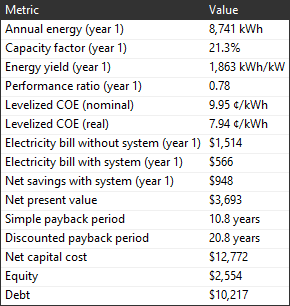
The following metrics are based on the utility bill calculations:
•Electricity bill without system and Electricity bill with system in the Metrics table is the Year 1 total annual electricity bill with and without the system.
•Net savings with system is the difference between the bill without system and the bill with system, and is also the value of electricity savings for Year 1 on the project cash flow.
•Net present value (NPV) is the present value of the project's annual after-tax cash flow. A positive value indicates the value of the electricity bill savings is greater than the cost of the system over the analysis period. A negative value indicates that the project costs more than it saves.
•Payback period is affected by the net savings: A project with more savings will have a shorter payback period than one with less savings.
Data Tables
Use the Data Tables tab to explore the electricity bill results.
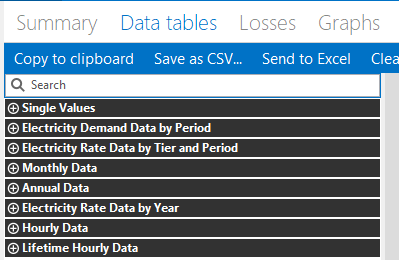
The Data Tables tab shows data for the electricity bill with and without the system over different periods. The following tables show data used for electricity bill calculations:
Monthly Data
The monthly data tables show the electricity bill components by month. Use these tables to see how the monthly electricity bill is calculated from the fixed, energy, and demand components, and how credits for excess generation are applied.
Annual Data
The annual data tables show annual totals of the electricity bill components over the analysis period. You can compare these values to the annual cash flow data to see how the electricity bill affects the project cash flow.
Electricity Rate Data By Year
The data-by-year tables are month-by-year matrices that show the electricity bill components by month over the analysis period. These tables show how credits roll over from year to year.
Electricity Rate Data by Tier and Period
For complex electricity rates with time-of-use and tiered energy rates, these tables show energy charges for each month in Year 1 by time-of-use period and tier. Use these tables to see how time-of-use and tiered charges are calculated, and to see how credits are applied.
Electricity Demand Data by Period
For electricity rates with time-of-use demand rates, these tables show demand charges for each month in Year 1.
Hourly Data / Subhourly Data
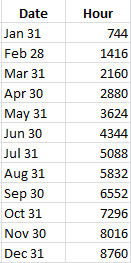
The hourly/subhourly data tables shows time series data over the first year (Year 1) of the analysis period. Use this table to compare time series power data and electricity sales and purchase data for the net billing and buy all / sell all options that calculate electricity bill amounts from time series data instead of monthly totals.
Note. The Lifetime Hourly/Subhourly Data tables show data from the performance model. They do not show data from the electricity bill calculations.