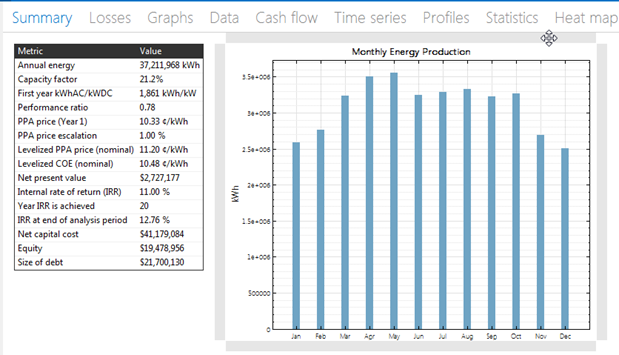
The Summary tab displays the Metrics table with a selection of results for each case in the project file and a selection of graphs.
Use the Data tables tab to list all of the case's results, and Graphs tab to create more graphs of results.
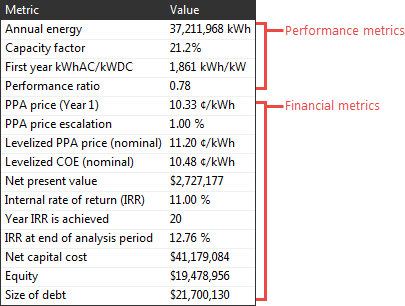
Metrics Table
For a list and descriptions of the variables in the Metrics table, see
•Financial Metrics for metrics from the financial models, such as levelized cost of energy (LCOE), levelized PPA price, payback period, IRR, etc..
•Performance Metrics for metrics from the performance models, such as annual energy, capacity factor, etc.
The Metrics table shows financial model results from the Cash flow tab and performance model results. For example, this Metrics table shows results for the detailed photovoltaic performance model and single owner financial model:
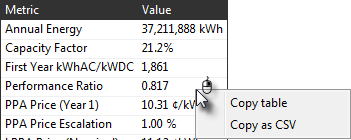
You can export data from the Metrics table by right-clicking it (control-click if your mouse has one button) and choosing an option, Copy table to copy the data to your computer's clipboard, or Copy as CSV to export it to a comma-separated text file:
Summary Graphs
The summary graphs are the graphs on the Summary tab. You can create your own graphs on the Graphs tab.
To export data or an image of a graph, right-click it (control-click on a mouse with one button) and choose an option from the shortcut menu.
To move a summary graph:
•Use your mouse to hover over an edge of the graph until the pointer changes to  and then drag the graph to a new position. You may need to resize other graphs to make room for the graph.
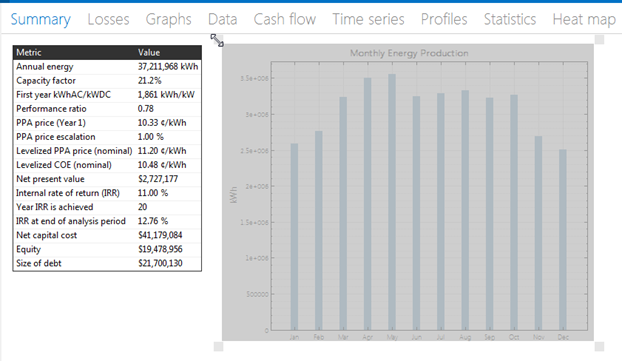
To resize a summary graph:
•Use your mouse to hover over a corner of the graph until the pointer changes to  and then drag the corner of the graph to make it larger or smaller.
To reposition the legend in a graph:
•Click the legend and drag it to a new position.