After you run a simulation, SAM displays results from both the performance and financial models. You can export data from any graph or table displayed on the results pages to Excel or text files.
To display results:
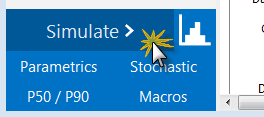
•Click Simulate to run a simulation and display results.
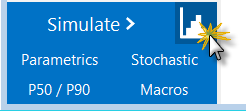
Or, click Switch to Results  to show results without running a simulation.
Use the tabs along the top of the Results page to display tables and graphs of data:

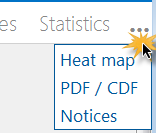
If you do not see all of the tabs because of the width of your computer's screen, click the ellipses to show tabs that do not fit in the horizontal bar:
Performance Model Results
•Summary displays the Metrics table with key metrics and graphs that summarize the performance model results, such as total annual electrical output, capacity factor, etc.
•Losses shows an energy loss diagram (not available for all performance models).
•Graphs allows you to create graphs of variables with hourly, monthly, annual, and single values.
•Data allows you to build tables of hourly, monthly, and annual results.
•Time series graphs display time series data and statistical graphs of hourly or subhourly data.
•Profiles displays time series data as daily profiles by month.
•Statistics displays the mean, maximum, minimum, sum, standard deviation, and average daily minimum and maximum values of time series data.
•Heat map displays one year's worth of time series data set in a single two-dimensional graphical representation using colors to indicate magnitude.
Financial Model Results
SAM's financial model uses the sum of the performance model's 8,760 hourly output values in kWh as an input representing the system's total annual electrical output in kWh. The financial model then calculates the project's cash flow based on the inputs you specify on the Installation Costs, Operating Costs, and Financial Parameters pages. SAM displays financial model results in the following places:
•Summary displays the Metrics table with key metrics such as the LCOE, PPA price, IRR, and payback period and graphs of the project's after-tax cash flow.
•Cash Flow shows details of the project's cash flow.
•Data allows you to build tables of cost and cash flow data along, metrics, and time-dependent electricity sales and price data.
•Time series data includes time-dependent electricity sales and price data.