SAM provides several options for exporting data and graph images to other applications for further analysis or inclusion in reports and other documents.
Input Data
The Inputs Browser lists all of the input variables for each case in the SAM file, and allows you to compare inputs in the different cases. You can export the data from the browser to a spreadsheet or text file as tab-delimited text.
To export input variable values from the Inputs Browser:
1.Start the Inputs Browser: On the SAM File menu, click Inputs browser.
2.Use your mouse to select the variables you want to export: First click a different cell in the table, and then carefully click and hold the cell you want to select. Then drag your mouse to select other variables in the table.
3.Press Ctrl-C to copy the values to your computer's clipboard.
4.Open the spreadsheet or text file to which you you want to copy the values.
5.Press Ctrl-V to paste the values.
Metrics Table Data
You can export data from the Metrics table by right-clicking it and choosing an option to copy the data to your computer's clipboard, which you can paste into a spreadsheet or other document.
Note. You can also use the Data table (single value) to display and export results variables from the metrics table, and other results that are not shown in the metrics table. For example, you can find the real LCOE in the Data table.
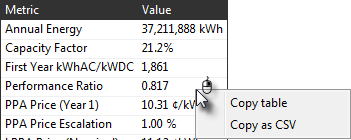
Copy table
Copies the metrics table to your computer's clipboard with columns separated by tabs.
Copy as CSV
Copies the metrics table to your computer's clipboard with columns separated by commas.
Graph Data and Images
Right-click any graph in SAM to display a shortcut menu of options for exporting graph data or an image of the graph. If your mouse has one button, use Control-click to display the shortcut menu. This works for graphs on input pages and on the Results page.
To export data:
Copy data to clipboard
Copies the data visible in the graph to your computer's clipboard. You can then paste the data into another program or document.
Save data to CSV
Creates a comma-separated text file containing the data visible in the graph.
Send data to Excel
Opens Microsoft Excel with a spreadsheet containing the graph data.

To export a graph image:
To clipboard (as shown/400x300/800x600)
Copy an image of the graph as it appears on the screen or using the given dimensions in pixels to your computer's clipboard.
Export (as shown/400x300/800x600)
Creates a file of the graph image in BMP, JPG, or PNG format.
Export as PDF/SVG
Creates a file of the graph image in PDF or SVG format. This option is best for images that you plan to resize later.
Table Data
Use the buttons along the top of the Results page to export data from tables. This works for The Cash Flows table and Data Tables provide three options for exporting data shown in the tables:
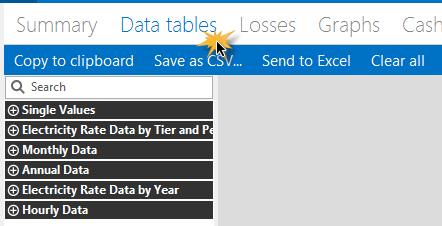
Copy to clipboard
Copies the table to your clipboard. You can paste the entire table into a word processing document, spreadsheet, presentation or other software.
Save as CSV
Saves the table in a comma-delimited text file that you can open in a spreadsheet program or text editor.
Send to Excel
Saves the table to a Microsoft Excel file. (Use Copy to clipboard to export data to a different spreadsheet program.)