There are two CSV formats for SAM's marine wave energy model:
•The Frequency of Occurrence format is for an annual probability distribution of sea states.
•The Time Series format is for time series data.
Both formats are comma-separated (CSV) text formats.
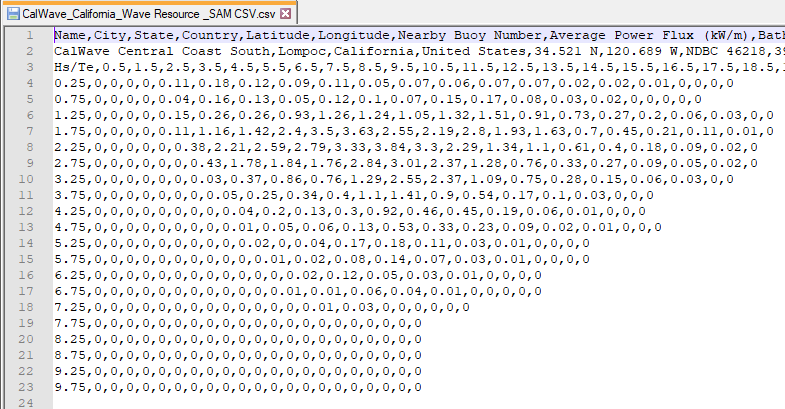
File Format for Frequency of Occurrence Wave Energy Resource Data
The Frequency of Occurrence wave energy resource file stores data for joint probability distribution plots of the wave resource at a site as described in Dallman, A.; Neary, V. (2014) Characterization of U.S. Wave Energy Converter (WEC) Test Sites: A Catalogue of Met-Ocean Data. 125 pp.; SAND2014-18206. Sandia National Laboratories. (PDF 8 MB)
For examples of files in the CSV wave energy resource format, see files in the wave_resource folder of your SAM installation folder.
The file contains the wave resource matrix, which is a table of joint probability distributions of significant wave height and wave energy period.
Notes.
SAM requires a 21-by-20 matrix of data for wave energy periods between 0.5 seconds and 20.5 seconds in 1-second increments and wave heights between 0.25 meters and 9.75 meters in 0.5-meter increments.
The column separator must be a comma, and the decimal separator must be a dot. Semicolons in the file will cause the weather file reader to fail.
Row 1
The first column of Row 1 contains the header Hs/Te, and the remaining columns contain wave energy period values in seconds in increasing order from 0.5 to 20.5 in increments of 0.5:
Hs/Te,0.5,1.5,2.5,3.5,4.5,5.5,6.5,7.5,8.5,9.5,10.5,11.5,12.5,13.5,14.5,15.5,16.5,17.5,18.5,19.5,20.5
Rows 2 and higher
The first column of Rows 2 and higher contains the significant wave height in meters in increasing order from 0.25 to 9.75 in increments of 0.5.
The remaining columns contain the joint probability distribution (JPD) of sea states representing a frequency of occurrence as a percentage.
0.25,0,0,0,0,0.11,0.18,0.12,0.09,0.11,0.05,0.07,0.06,0.07,0.07,0.02,0.02,0.01,0,0,0,0
0.75,0,0,0,0,0.04,0.16,0.13,0.05,0.12,0.1,0.07,0.15,0.17,0.08,0.03,0.02,0,0,0,0,0
1.25,0,0,0,0,0.15,0.26,0.26,0.93,1.26,1.24,1.05,1.32,1.51,0.91,0.73,0.27,0.2,0.06,0.03,0,0
1.75,0,0,0,0,0.11,1.16,1.42,2.4,3.5,3.63,2.55,2.19,2.8,1.93,1.63,0.7,0.45,0.21,0.11,0.01,0
2.25,0,0,0,0,0,0.38,2.21,2.59,2.79,3.33,3.84,3.3,2.29,1.34,1.1,0.61,0.4,0.18,0.09,0.02,0
2.75,0,0,0,0,0,0,0.43,1.78,1.84,1.76,2.84,3.01,2.37,1.28,0.76,0.33,0.27,0.09,0.05,0.02,0
3.25,0,0,0,0,0,0,0.03,0.37,0.86,0.76,1.29,2.55,2.37,1.09,0.75,0.28,0.15,0.06,0.03,0,0
3.75,0,0,0,0,0,0,0,0.05,0.25,0.34,0.4,1.1,1.41,0.9,0.54,0.17,0.1,0.03,0,0,0
4.25,0,0,0,0,0,0,0,0,0.04,0.2,0.13,0.3,0.92,0.46,0.45,0.19,0.06,0.01,0,0,0
4.75,0,0,0,0,0,0,0,0,0.01,0.05,0.06,0.13,0.53,0.33,0.23,0.09,0.02,0.01,0,0,0
5.25,0,0,0,0,0,0,0,0,0,0.02,0,0.04,0.17,0.18,0.11,0.03,0.01,0,0,0,0
5.75,0,0,0,0,0,0,0,0,0,0,0.01,0.02,0.08,0.14,0.07,0.03,0.01,0,0,0,0
6.25,0,0,0,0,0,0,0,0,0,0,0,0,0.02,0.12,0.05,0.03,0.01,0,0,0,0
6.75,0,0,0,0,0,0,0,0,0,0,0,0.01,0.01,0.06,0.04,0.01,0,0,0,0,0
7.25,0,0,0,0,0,0,0,0,0,0,0,0,0,0.01,0.03,0,0,0,0,0,0
7.75,0,0,0,0,0,0,0,0,0,0,0,0,0,0,0,0,0,0,0,0,0
8.25,0,0,0,0,0,0,0,0,0,0,0,0,0,0,0,0,0,0,0,0,0
8.75,0,0,0,0,0,0,0,0,0,0,0,0,0,0,0,0,0,0,0,0,0
9.25,0,0,0,0,0,0,0,0,0,0,0,0,0,0,0,0,0,0,0,0,0
9.75,0,0,0,0,0,0,0,0,0,0,0,0,0,0,0,0,0,0,0,0,0
Header Label |
Description |
Name |
Name of wave resource site |
City |
Name of city onshore nearest the site |
State |
State name or abbreviation |
Country |
Country name |
Latitude |
Latitude, for example 35.4 N, 25.6 S |
Longitude |
Longitude, for example 120.689 W, 64.3 E |
Nearby Buoy Number |
Identification number for nearest marine observation buoy |
Average Power Flux (kW/m) |
The average annual power flux measured at the site |
Bathymetry |
The submarine topography at the site |
Sea Bed |
The soil composition of the sea bed |
Time Zone |
The time zone of the site, for example -7, 2 |
Data Source |
The source of wave resource data |
Notes |
Additional information about the data |
Time Series Format for Wave Energy Resource Data
The time series format for wave energy resource data is the CSV format returned by the NREL Developer APIs for wave resource data:
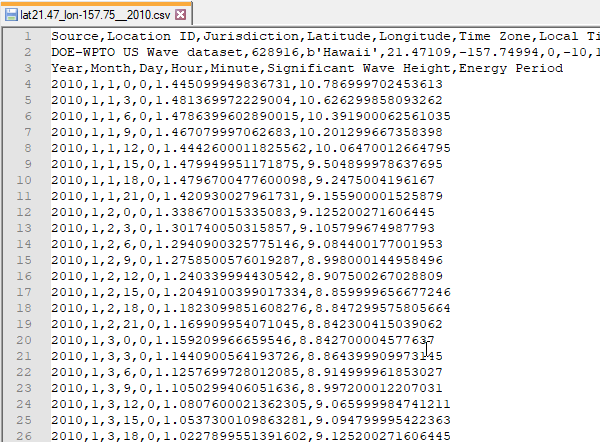
Rows 1 and 2
These header rows contain information about the location.
Rows 3 and higher
Row 3 contains column headings for the time series wave data. NREL's Hindcast Wave Data provides time series data in three-hour time steps, but SAM will work with data in one-hour time steps. The columns can be in any order, but should use the names listed in the table below.
Rows 4 and higher contain the data itself.
Column Label |
Description |
|---|---|
Year |
Year data was measured or modeled. |
Month |
Month data was measured or modeled. |
Day |
Day data was measured or modeled. |
Hour |
Hour data was measured or modeled in increments of three hours. |
Minute |
Minute data was measured or modeled. |
Significant Wave Height |
Wave height in meters. |
Energy Period |
Wave energy period in seconds. |