A parametric simulation involves assigning more than one value to one or more input variables to explore the dependence of a result on the inputs. Parametric simulations are useful for creating graphs that show relationships between a results metric and inputs, for example to show the show the relationship between internal rate of return and power purchase agreement price for the single owner financial model. Parametric simulations are also useful for optimizing the value of input variables, for example, for photovoltaic systems, create a graph of annual electricity to grid (or levelized cost of energy) versus array tilt and azimuth to optimize the array orientation.
For a video demonstrating parametric simulations, see Parametric and Statistical Analysis in SAM.
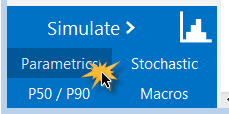
Click Parametrics in the lower left corner of the main window to display the Parametric Simulations page:
Overall steps for running parametric simulations:
1.Set up parametric inputs by choosing parametric input variables and assigning values to them.
2.Choose output metrics.
3.Run parametric simulations.
After running the parametric simulations, SAM displays tables and graphs of the results on the Parametric Simulations page. You can use this information to choose an optimal value for an input variable, or export the data or graphs to explore relationships between input variables and results. These parametric simulation results are separate from the case results that appear on the Results page.
Tips. (See Tips and Tricks below for more.)
Click a column heading to sort the table. Right-click a heading to filter values in the table.
Right-click a row in the table to show all of the inputs for the parametric case represented by the row, or to create a new SAM case with inputs from the parametric table.
Set Up Parametric Inputs
To set up parametric inputs, you can either use Quick Setup, or create a table by hand, or a combination of the two:
•Quick Setup allows you to use a start value, end value, and increment to assign values to each input variable.
•Setting up the table by hand is best when your parametric simulation involves more than one input variable and you want to limit the number of combinations of values.
Note. Some input variables in the SAM case are not available for parametric analysis because they are arrays of values.
Option 1. Quick Setup
Use Quick Setup with a single parametric input, or when you want to model all combinations of values of multiple inputs.
To use Quick Setup:
1.On the Parametric Simulations page, click Quick setup.
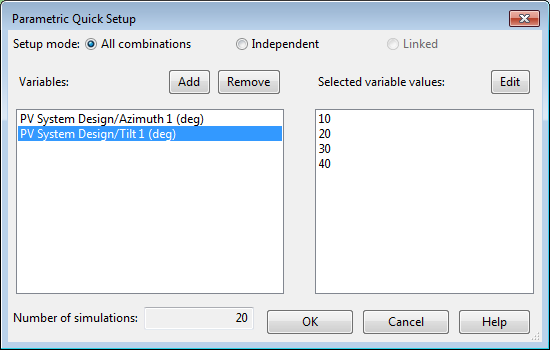
2.Choose All combinations, Independent, or Linked.
All combinations: Assign all values to all variables. For example, an analysis on two variables, tilt angle with four values and azimuth angle with five values would result in 4 × 5 = 20 simulations.
Independent: Set the value of each variable to its value on the input page and assign the values you specify in Quick Setup to the remaining variables. For the example above, this would result in 4 + 5 = 9 simulations
Linked: When variables have the same number of values, run only a single simulation for each set of values. For example, an analysis on two variables, location with three values and subarray tilt angle with three values would result in three simulations.
Note. For an annotated example of each Quick Setup option, see the parametric-quick-setup-example.sam file in the SAM sample file collection.
3.In the Quick Setup window, click Add, and check one or more parametric input variables. Type a few letters of the variable name in the Search box to filter the list.
4.Click OK.
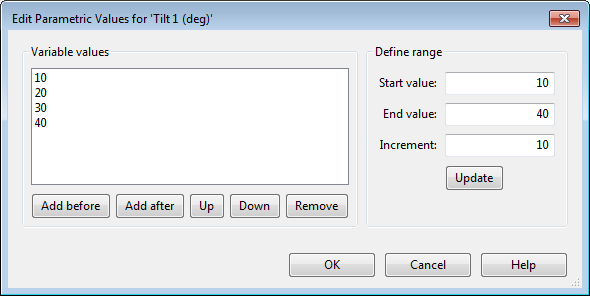
5.In the Variables list, double-click the first variable name in the list.
6.For Start value, type a beginning value for the range of values.
7.For End value, type the last value in the range.
8.For Increment, type the step by which you want values in the range to increase.
9.Click OK.
10.Repeat Steps 5 through 9 for each variable in the list.
11.Click OK.
12.Click Yes to overwrite any values in the current parametric simulations table.
SAM automatically populates the table with the input variables and values along with the Number of runs. If you cannot see the entire table, you can use the vertical scroll bar or drag the grey divider line downward to see more of the table.
Option 2: Set up parametric table by hand
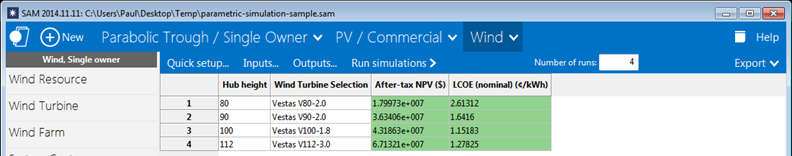
Set up the parametric table by hand when your analysis involves more than one parametric input and you want to limit the combinations of values. For example, for a parametric study of different types of wind turbines, you might want to use a specific hub height for each wind turbine.
To set up the parametric table by hand:
1.On the Parametric Simulations page, click Inputs.
2.Check each input variable that you want to include in the parametric simulations. Type a few letters of the variable name in the Search box to filter the list.
3.On the Parametric Simulations page, for Number of runs, type the number of parametric cases you want to simulate. The table displays a row for each run. For more than about eight runs, you may need to adjust the height of the area displaying the table by dragging the grey border below the table down.
4.In the table, type or choose a value for each parametric input.
Choose Output Metrics and Run Simulations
The output metrics are the results you are using to evaluate the parametric inputs. For example, to investigate the impact of photovoltaic array tilt angle on system electricity output, you might choose Tilt as the input variable and Annual AC energy in Year 1 as the output metric.
To choose output metrics and run parametric simulations:
1.Use one of the methods described above to set up parametric inputs.
2.Click Outputs, and choose one or more output metrics for the analysis.
3.Click Run Simulations.
SAM displays values for each of the output metrics in the table and displays a graph for each output metric below the table.
Parametric Table Tips and Tricks
Each row in the parametric table represents a parametric case with a complete set of results. Each column in the table is for an input variable or output variable. Right-click the row or column heading to see a menu of commands.
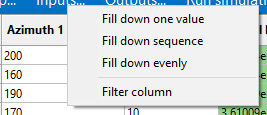
Input Column Commands (right-click input column heading)
Use the input column commands to set the value of inputs as an alternative to using Quick Setup or setting up the table by hand as described below. The input column commands make it easier to populate the table with patterns of values.
Note. Before using the input column commands, click Inputs to add the input variables for your parametric analysis, and add empty rows to the table by setting Number of runs to the number of runs for your analysis.
Fill down one value
Fill the column with the value from the first row.
Fill down sequence
Fill the column with a sequence of numbers defined by the values in the first and second row.
Fill down evenly
Fill the column with a sequence of evenly distributed values defined by the values in the first and last row.
Filter column
Hide values in the column that are outside of the range of values you specify.
Output Column Commands (right-click output column heading)
Use the output column commands after you run a parametric simulation.
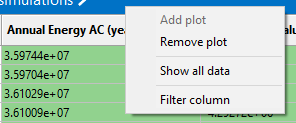
Add / Remove plot
Add or remove the graph of the data in the column that appears below the table.
Show all data
Open a window with a list of the values in the column. This might be useful for exporting the values.
Filter column
Hide values in the column that are outside of the range of values you specify.
Row Commands (right-click row heading)
Each row in the table represents a parametric case, which consists of the input variables in the table with all of the remaining inputs set to values on the input pages. The SAM case consists of input variables on the input pages.
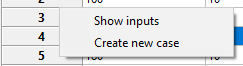
Show inputs
Open the inputs browser showing all of the inputs for the parametric case.
Create new case
Create a new SAM case with inputs from the parametric case.
Table Commands (right-click top left corner of table)
The table commands replicate commands on the Export menu described below.
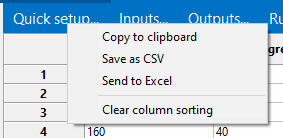
Copy to clipboard
Copy the data from the table to your computer's clipboard as comma-separated data.
Save as CSV
Save the data from the table to a text file as comma-separated data.
Send to Excel (Windows only)
Save the data from the table to an Excel file.
Clear column sorting
Clear all filters so that the table shows all data.
Example: Graph the relationship between an input variables and a result
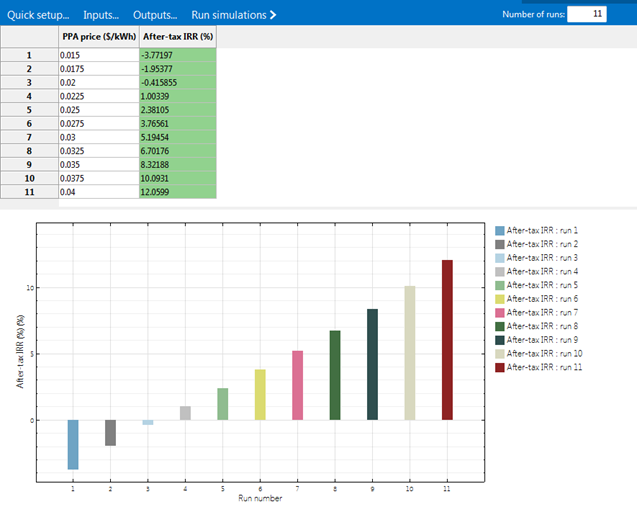
The following graph is for an imaginary 58 MW wind farm with an installed cost of $1,600 per kW, and shows the relationship between the project internal rate of return (result) of return and PPA price (input). The graph shows that the project requires a PPA price of at least 2.25 cents/kWh to make a positive return on investment:
Import Parametric Inputs
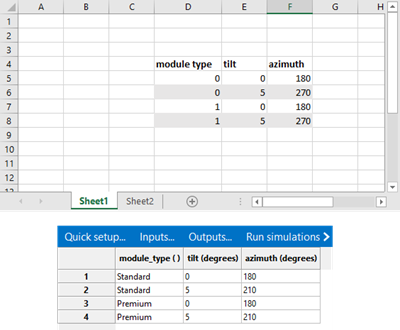
You can import parametric input variables and their values from an Excel workbook. The workbook must be formatted as follows:
•The first worksheet in the workbook must contain a table with a column for each parametric variable. The table should look similar to the parametric input table in SAM
•Each column heading should contain a SAM variable name or label. Click Inputs to see a list of available variables showing each variable's name and label. The list displays all of the variables in the case using the format label {'name'} (units) [type].
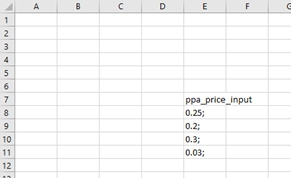
•The table can be anywhere in the worksheet, but all columns containing parametric data to import must be adjacent to each other. The worksheet may contain other numbers or formulas, but not other text. SAM identifies the columns by searching cells for variable names and ignores any other numbers in the sheet.
•For input variables that are arrays, separate values in the array with semicolons. If the array has a single element, put a semicolon after the single value.
Export Parametric Inputs
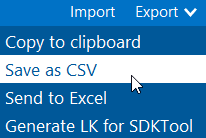
The export tools allow you to export the table of parametric simulation results to your computer's clipboard, a CSV file, or for Windows versions of SAM, to Microsoft Excel.
Note. You can also use your computer's clipboard to export data from the table by selecting cells in the table and pressing Ctrl-C to copy the data to the clipboard. Click a column or row heading to select a column or row, or click the empty heading at the top left corner of the table to select the entire table. This method copies data without column or row headers.
If you are working with the SAM Software Development Kit (SDK), you can also export the parametric inputs to LK for SDKtool. Note that SAM exports each parametric case as a separate LK script, but you can modify the script yourself to add loops to perform the parametric simulations in the script.
If you are working with LK script in SAM, you can modify the LK for SDKtool to work in SAM by removing the calls to the clear() and run() functions, and by replacing the var() function with set().